L1
Layer 1 — Conservation tillage
This is what we mean by verification
Des Moines County, Iowa — Layer 1: Conservation Tillage
For twelve days, this series has explained the verification gap in §45Z. Today we move from the problem to one possible answer.
For an ethanol facility, verification is not a documentation exercise. It is the independent evidence layer beneath credit value.
What follows is Layer 1 of that evidence architecture: conservation tillage in Des Moines County, Iowa, inside the sourcing radius of a real operating ethanol plant.
What do we mean by verification?
In the context of §45Z, verification means producing independent evidence — not self-reported records, not attestation forms, not data entered into a platform by the party claiming the credit — that a specific climate-smart agriculture practice was physically performed, on specific acres, in a specific crop year.
Independent means the evidence originates from a source the claimant cannot influence. Reproducible means any qualified reviewer can reach the same result from the same publicly archived data.
That verification structure is a different standard than traceability, documentation management, or chain-of-custody. Those functions organize and transmit what someone reported. Verification tests whether the reported practice actually occurred.
What is Layer 1?
Conservation tillage is the practice of leaving crop residue on the field surface after harvest instead of plowing it under. It reduces soil disturbance, retains moisture, builds organic carbon, and critically for §45Z, is the single largest practice-based driver of carbon intensity reduction at the field level.
Layer 1 is our satellite-based detection of conservation tillage. The optical layer classifies surface residue using a multi-factor model derived from ESA Sentinel-2 multispectral imagery. A second, independent layer then tests unresolved acres using Sentinel-1 synthetic aperture radar (active microwave pulses) that operate on entirely different physics, penetrate cloud cover, and work in any weather.
When both systems agree, the result carries dual-physics corroboration. When they disagree or cannot classify with confidence, the acre is labeled UNKNOWN and counted against the claim, not for it.
Why Des Moines County?
Des Moines County is home to the Big River Resources West Burlington ethanol facility, a farmer-owned cooperative producing 105 million gallons of ethanol annually from approximately 30 million bushels of corn. It was built by local farmers from Des Moines County, Iowa and Henderson County, Illinois who joined together to create a cooperative venture in renewable fuels.
The county contains a mix of tillage practices; the 2022 USDA Census reports 35% no-till, 31% reduced till, 20% intensive till, and 10% cover crop adoption. It is not a showcase county. It is a working agricultural landscape with real variation in practice adoption.
We selected it as our sample space because it represents the real-world unit of analysis: a county inside the sourcing radius of an operating facility, where the verification question is not theoretical: it is financial.
What does the USDA Census tell us — and what doesn’t it?
The 2022 Census of Agriculture is the most comprehensive public dataset on farming practices in the United States, conducted every five years by USDA’s National Agricultural Statistics Service. For Des Moines County, it reports that 75.8% of farms use some form of conservation tillage: no-till plus reduced till combined.
That number is our benchmark, not our answer.
The Census is a survey. It tells you what farmers reported about their practices. It is collected at the farm level, not the acre level. It does not tell you which specific fields were under conservation tillage, or in which growing season, or whether the practice reported in a survey response was actually performed in the year a §45Z credit is claimed.
The Census provides the landscape. Verification provides the evidence.
What did we find?
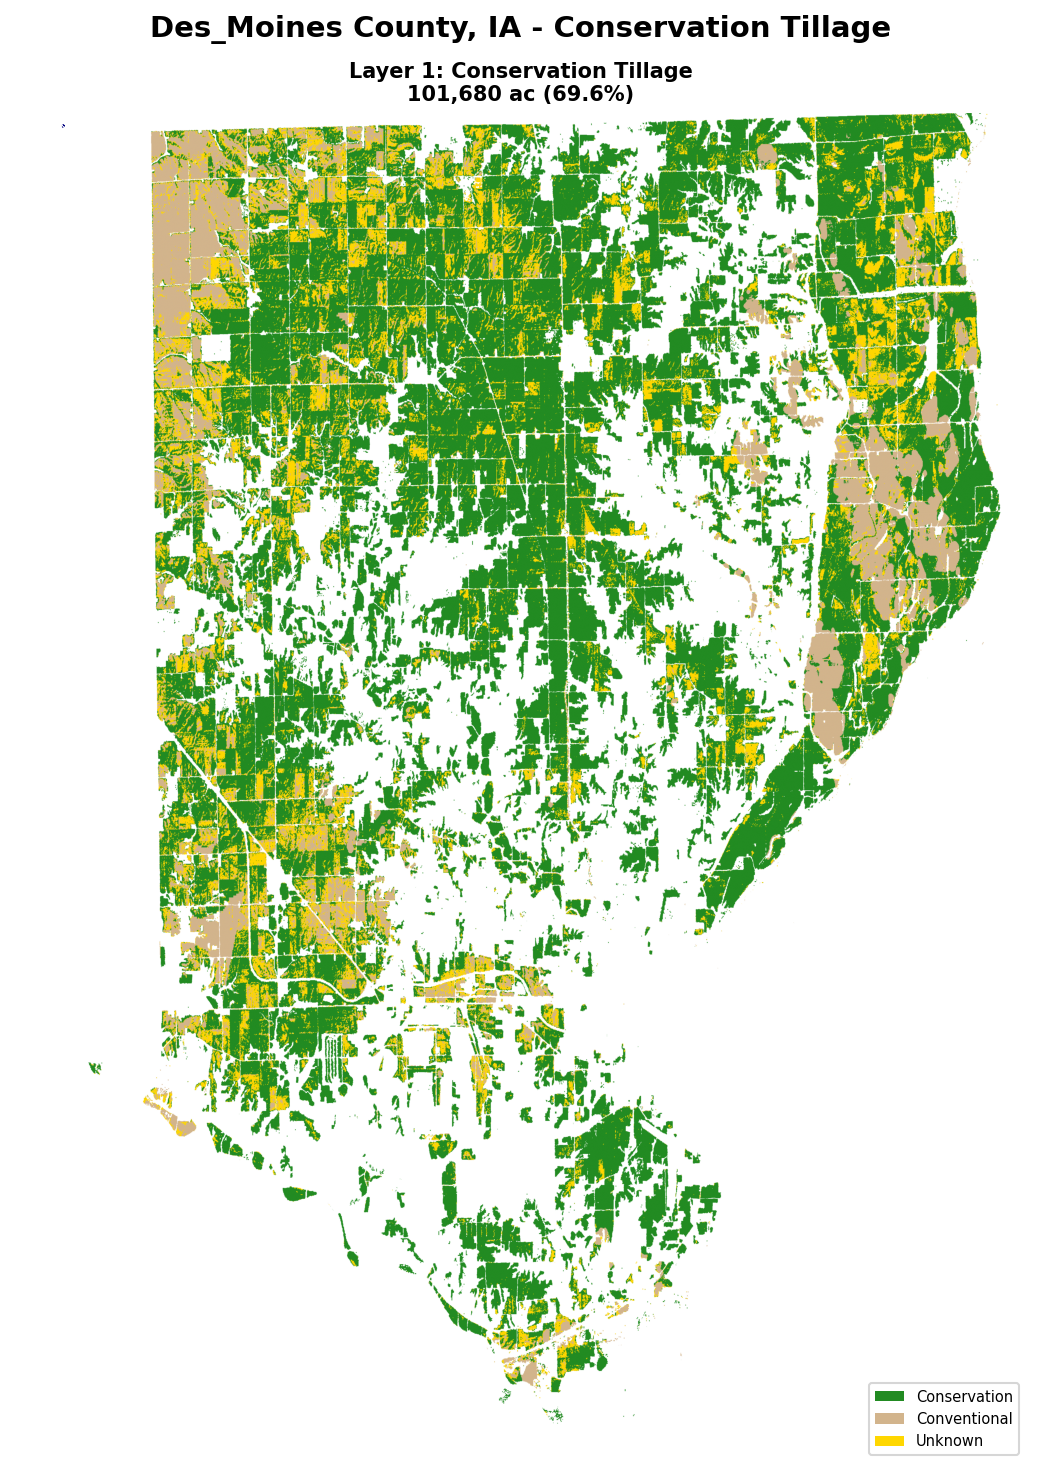
Des Moines County, IA — Layer 1: Conservation Tillage. Green = Conservation | Tan = Conventional | Yellow = UNKNOWN
We classified every cropland pixel in Des Moines County at 10-meter resolution using USDA Cropland Data Layer boundaries as the spatial mask. No farmer was enrolled. No self-reported data was collected. Every result comes from publicly archived satellite observations.
The optical layer alone identified 52.1% conservation tillage and 27.1% conventional. But 20.7% of classified acres could not be resolved with confidence. Those acres were not dropped. They were not averaged into the nearest category. They were labeled UNKNOWN.
Then the radar layer tested the result. It resolved roughly half of the optical UNKNOWN pool, and of the acres it resolved, 99.8% were conservation tillage. The UNKNOWN floor dropped from 20.7% to 10.7%.
Final result: 67.7% conservation tillage. 21.6% conventional. 10.7% UNKNOWN, carried forward in the denominator, counting against the claim.
The improvement from optical-only to dual-physics corroboration: conservation tillage rose from 52.1% to 67.7%, a 15.6 percentage point gain, driven entirely by resolving uncertainty, not by reclassifying conventional acres.
The USDA Census benchmark is 75.8%. Our final result is 8.1 percentage points lower. That gap is intentional. It is the cost of counting uncertainty against the claim rather than distributing it conveniently.
Why the year-over-year pattern matters
We did not analyze a single snapshot. We collected satellite observations from 2020 through the present. When the same pixel locations show the same tillage classification year after year — persistence rates of 94–99% across growing seasons — that temporal consistency becomes its own form of corroboration.
This matters for two reasons.
First, it validates the detection method. If the same acres are classified as conservation tillage in 2021, 2022, 2023, 2024, and 2025, that is not coincidence. It is a stable physical practice being reliably detected across multiple growing seasons.
Second, it builds the foundation for crop rotation. When we track the same pixels across multiple years, we can observe the phenological signature of corn-to-soybean and soybean-to-corn transitions. The year-over-year tillage consistency confirms that our pixel-tracking infrastructure is sound before we use it to detect rotational changes. Conservation tillage is Layer 1. The temporal stability of Layer 1 is what makes Layer 3 (crop rotation) possible.
What this means for an ethanol facility
A plant CFO looking at these results sees five answers to the five questions an auditor will ask:
- Was the practice actually performed? 67.7% of cropland acres carry the physical signature of conservation tillage; observed from the ground surface, not reported by the farmer.
- On which specific acres? Every classified acre is resolved to a 10-meter coordinate. Any parcel in a facility’s sourcing area can be isolated, and its verification status reported independently.
- In the relevant tax year? Every satellite observation is date-stamped to the growing season. A 2024 result cannot be substituted for a 2023 claim.
- Independent of the party claiming the credit? The imagery is collected by the European Space Agency and archived publicly. No party in the credit chain can alter what was recorded.
- What is the uncertainty, and which way does it lean? 10.7% of acres remain UNKNOWN — not dropped, not averaged, but counted against the claim. The system errs conservative by design.
And there is a sixth answer the auditor does not ask but the CFO should: verification does not just protect credits. It shows which acres in a sourcing radius are most valuable in a low-CI strategy. That information turns compliance into procurement intelligence.
What comes next
This is Layer 1 of what an audit-defensible, county-scale substantiation architecture looks like for an ethanol plant. Conservation tillage is one of three climate-smart practices we generate independent field-level evidence for, alongside cover crops and crop rotation.
In the posts ahead, we will show the rest of the stack.
For facilities thinking through what a defensible §45Z substantiation strategy would actually require inside their sourcing radius, that conversation is no longer theoretical.
Download the full article with maps
Get the complete Layer 1 verification article as a PDF, including satellite maps and classification data.
Register to download →