L2
Layer 2 — Cover crops
Two counties. Same method. Different answers.
Des Moines County vs. Washington County, Iowa — Layer 2: Cover Crops
Yesterday’s article showed what independent verification looks like when the result is large — 67.7% of Des Moines County under conservation tillage. Today the result is different. In one county, cover crop adoption is sparse. In another, forty miles away and inside the same ethanol sourcing radius, it is substantial.
A verification system that produces the same answer everywhere is not reading the ground. It is modeling an assumption.
Layer 2 represents cover crops. Same methodology applied to both counties. The maps tell different stories, and that difference is exactly the intelligence an ethanol facility needs.
What is Layer 2?
Cover cropping is the practice of planting a secondary crop — typically cereal rye, crimson clover, or a winter-hardy mix — after the cash crop is harvested in the fall, then terminating it before planting the following spring. The cover crop protects soil from erosion over winter, builds organic matter, suppresses weeds, and improves water retention.
For §45Z, cover crops are the second of three climate-smart agriculture practices that reduce a facility’s carbon intensity score. Cover crops are also the hardest to detect from orbit because the signal is not a residue pattern left on the surface after harvest. It is a living plant that grows during the off-season, when cloud cover is frequent and the growing window is short.
Layer 2 detects cover crops by tracking the vegetation trajectory across an eight-month window (from October through May) using Sentinel-2 optical imagery. A field with a cover crop shows a distinctive pattern: green-up during the off-season when surrounding bare fields remain dormant, followed by a sharp termination drop as the cover is killed before cash crop planting. That trajectory is the signature. A single-date snapshot cannot capture it.
Cover crops in context
Cover crop adoption is growing nationally, but it remains early-stage. The 2022 USDA Census of Agriculture reported cover crops on 18 million acres nationwide; approximately 4.7% of all U.S. cropland. In Iowa, Illinois, and Indiana combined, the adoption rate was 5.1% of cropland in 2022, up from 3.8% in 2017. But growth has decelerated: the I-states added roughly 535,000 cover crop acres between 2017 and 2022, compared to 1.3 million in the prior five-year period.
More importantly, cover crops are subject to disadoption. Research from Iowa State’s Center for Agricultural and Rural Development found that 32% of I-state counties experienced declines in cover crop adoption between 2017 and 2022. Farmers adopt cover crops, then stop because of cost, yield concerns, or the end of incentive payments. A practice reported in a Census year may not happen in the credit year.
That is why year-over-year persistence tracking matters even more for cover crops than for tillage.
Des Moines County: the sparse signal
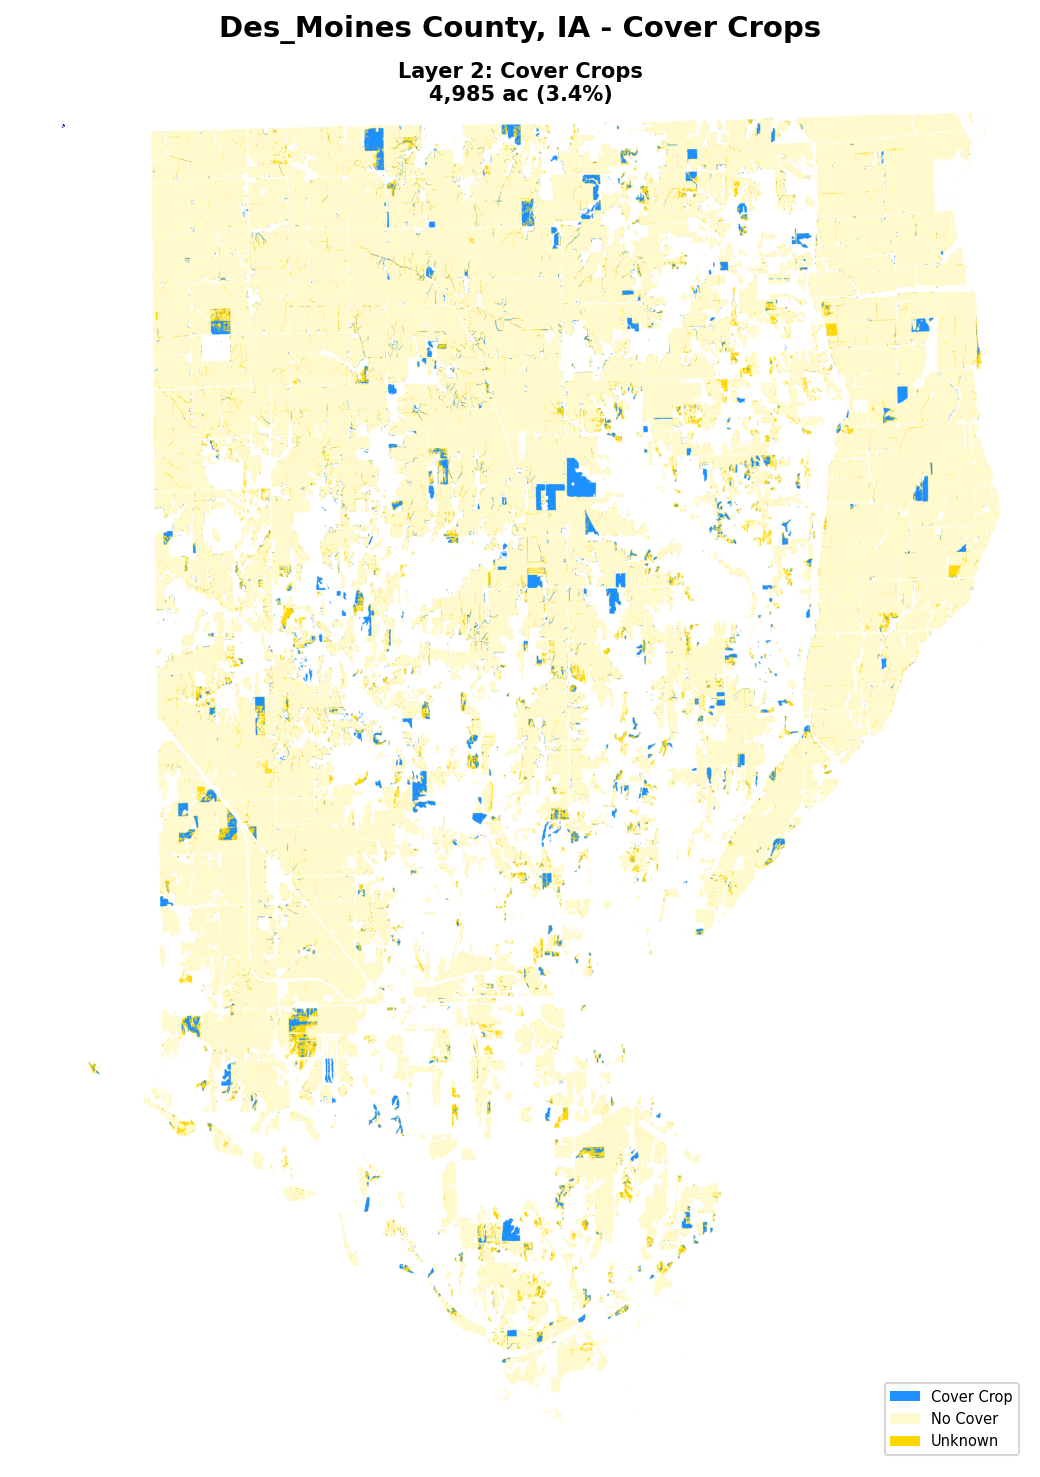
Des Moines County, IA — Layer 2: Cover Crops. Blue = Cover Crop | Yellow = No Cover | Gold = UNKNOWN
The 2022 USDA Census reports that 10% of farms in Des Moines County use cover crops, representing approximately 4,965 acres or 4.5% of cropland.
Our satellite detection found 3,460 acres, or 1.7% of cropland. The map is mostly yellow. The blue patches are real; they passed the full eight-month trajectory test, but they are scattered and sparse.
The gap between our result and Census is −2.8 percentage points; the same conservative direction as Layer 1. But for cover crops, the gap is wider, and the reason matters: Des Moines County sits along the Mississippi River floodplain, where soil moisture variability and spectral noise make cover crop signals harder to isolate from background conditions. The system classified this county as Tier 3: contextual, requiring interpretation.
Persistence tells the rest of the story. Of the baseline cover crop pixels identified in 2022, only 30.6% showed the signature again in 2023, 43.3% in 2024, and 20.3% in 2025. Average persistence: 31.4%. These are not committed adopters maintaining a permanent practice. These are fields rotating in and out of cover cropping; intermittent, not established.
A system optimized for higher acreage totals could have produced a larger number. A system built to survive examination reports only what the evidence can support.
Washington County: the strong signal
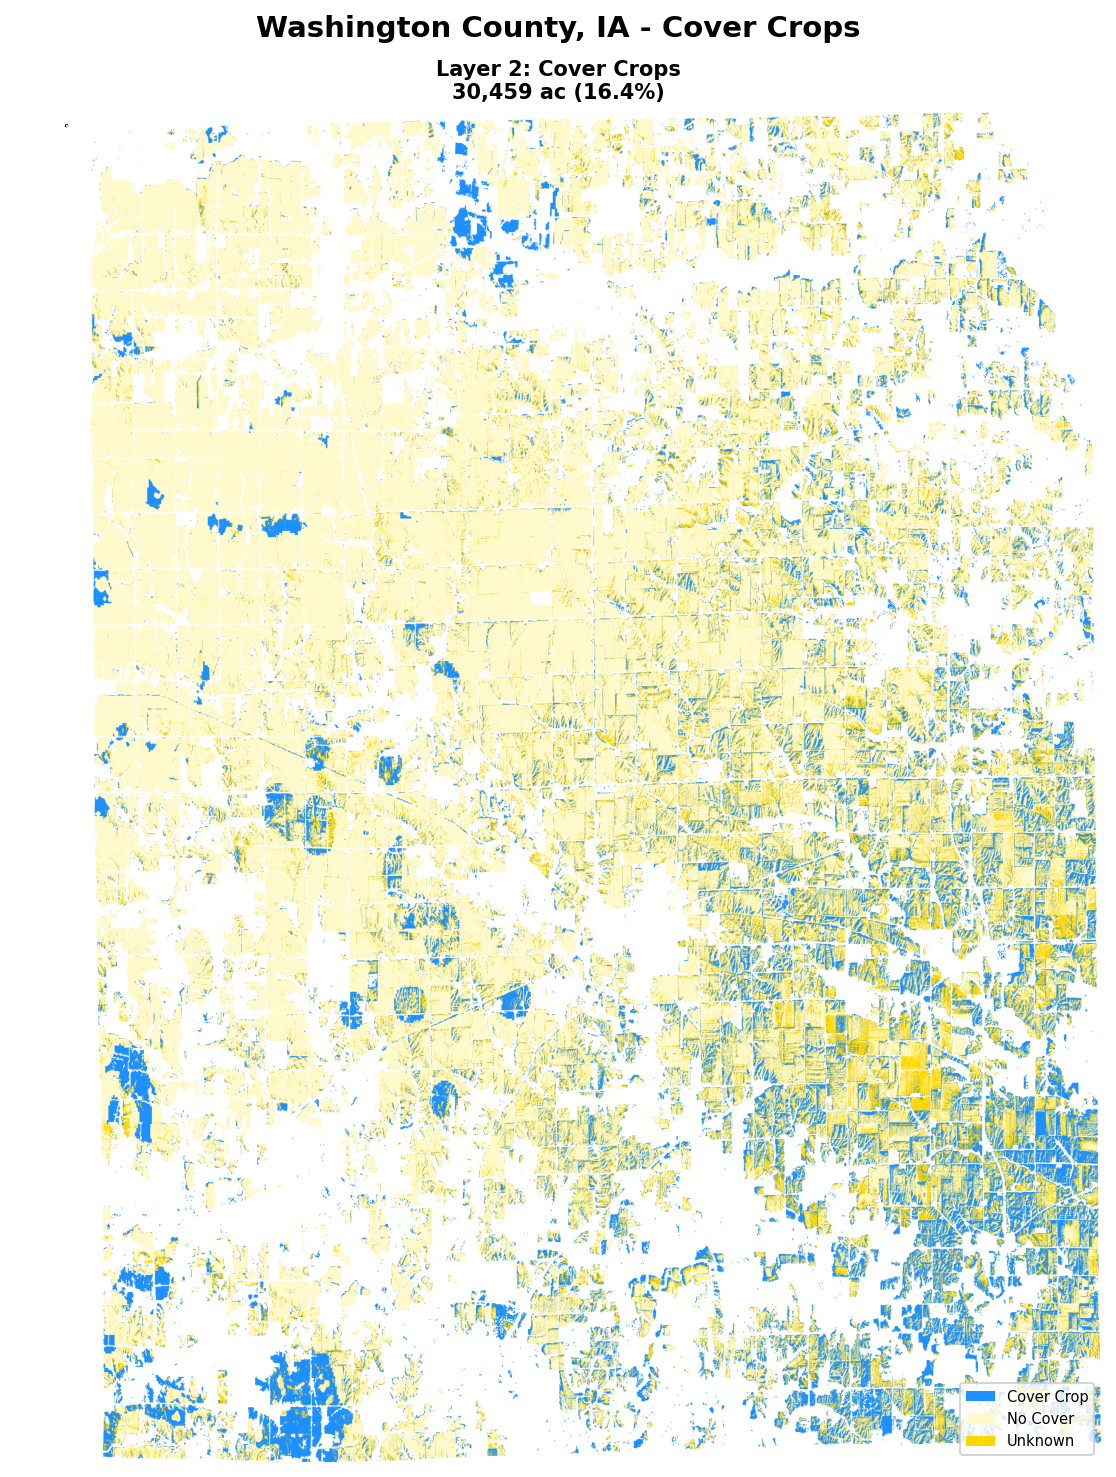
Washington County, IA — Layer 2: Cover Crops. Blue = Cover Crop | Yellow = No Cover | Gold = UNKNOWN
Forty miles northwest of Des Moines County, still inside the West Burlington sourcing radius, Washington County tells a completely different story.
The 2022 Census reports 17.8% cover crop adoption, the highest in the region, with 256 farms planting cover crops across 37,955 acres. Our satellite detection found 30,459 acres at 16.4%. The map shows blue spreading across the landscape, especially concentrated in the southern and western portions of the county.
The persistence numbers confirm what the map suggests: 82.2% in 2023, 99.8% in 2024, 97.6% in 2025. These producers are committed adopters. The same pixels show the cover crop signature year after year — not intermittent experimentation, but an established practice embedded in a stable rotation.
Washington County classified as Tier 1, the highest confidence level in our MRV framework. Detection rate above 10%, persistence above 60%, Fisher discriminant ratio strong. This analysis shows a county where the satellite reads a clear, repeatable signal.
For a plant CFO, this means the same sourcing radius can contain both high-value and low-value practice geographies, and the difference cannot be seen from regional averages alone.
Why the contrast matters
Same satellite. Same classifier. Same eight-month trajectory method. Same sourcing radius. Two counties that look nothing alike on cover crops.
Des Moines County: 1.7% cover crops. 31% average persistence. Tier 3. River-influenced, intermittent adoption.
Washington County: 16.4% cover crops. 93% average persistence. Tier 1. Committed adopters, stable year over year.
That variation is invisible if all you have is a regional self-reported average. It becomes visible — and actionable — when you have independent, county-level, acre-level verification evidence.
For a plant sourcing corn from both counties, this distinction directly affects the blended CI score. A bushel from Washington County carries more cover-crop CI value than a bushel from Des Moines County. Not because the corn is different but because the practices behind it are different, and now that difference is independently verified.
This result is what procurement intelligence looks like at the practice level: not all acres in a sourcing radius contribute equal CI value.
Why radar does not apply to Layer 2
In Layer 1, the Sentinel-1 SAR radar system resolved half the optical UNKNOWN pool and confirmed 99.8% as conservation tillage. For cover crops, SAR does not play that role.
Tillage leaves a surface roughness signature that radar reads well. Cover crops are living vegetation growing during a period of high soil moisture, frequent freeze-thaw cycles, and variable snow cover — conditions that create noise in the radar signal. We document that limitation rather than forcing a result. Layer 2 is optical-only, and the methodology is transparent about what each sensor can and cannot do.
What this means for an ethanol facility
The same five auditor questions apply to cover crops and Layer 2 produces independent field-level evidence for both counties:
- Was the practice actually performed? In Des Moines County, 3,460 acres show the cover crop trajectory. In Washington County, 30,459 acres. Both detected from orbit, not reported by the farmer.
- On which specific acres? Every detected acre resolves to a 10-meter coordinate, isolatable to any parcel in a facility’s sourcing area.
- In the relevant tax year? The eight-month trajectory is anchored to a specific growing season. A cover crop detected in 2024 cannot be substituted for a 2025 claim — and the persistence data shows exactly which acres repeated and which did not.
- Independent of the party claiming the credit? Same ESA public archive. Same structural independence from the claimant.
- What is the uncertainty? Both counties show results below Census-reported adoption rates. Des Moines: −2.8 pp. Washington: −1.4 pp. The method errs conservatively rather than optimizing for maximum acreage.
What comes next
Layer 1 showed what verification looks like when the result is large. Layer 2 shows what it looks like when the same method produces two different answers in the same sourcing radius — and why both answers matter.
A system that reports the same number everywhere is not verifying. It is averaging. A system that finds 1.7% in one county and 16.4% forty miles away, using the same classifier, the same satellite, and the same rules — is reading the ground.
Layer 3 will show crop rotation, the practice that connects the year-over-year pixel tracking from Layers 1 and 2 into a temporal chain.
For facilities evaluating which practices in their sourcing radius actually move the CI needle, the answer is not the same in every county. That is the point of field-level evidence.
Download the full article with maps
Get the complete Layer 2 verification article as a PDF, including satellite maps, persistence data, and county comparisons.
Register to download →