L3
Layer 3 — Crop rotation
Crop rotation is easy to claim and hard to prove
Putnam County & Darke County, Ohio — Layer 3: Crop Rotation
For two weeks, this series has explained the verification gap inside §45Z. Layer 1 showed what conservation tillage looks like when tested against independent field-level evidence. Layer 2 showed the same for cover crops.
Today we move to Layer 3.
Crop rotation is the hardest of the three climate-smart practices to verify independently. And it is the one most often assumed rather than tested.
Tillage leaves a surface signature. Cover crops leave a temporal one. Rotation requires something different: identifying which crop is growing on a specific field, in a specific year, and then tracking whether that classification changes across multiple years.
That is a time-series problem, not a snapshot. And it is where most verification claims quietly fall apart.
What do we mean by crop rotation verification?
In the context of §45Z, verifying crop rotation means producing independent evidence that a field changed crops between growing seasons in a way consistent with an intentional agronomic rotation rather than random year-to-year variation.
This agronomic review is not the same as checking a box on a form.
Most crop rotation claims in the carbon credit and biofuel compliance space rely on grower self-reporting. A farmer tells a platform what was planted each year. The platform records it. The record becomes the evidence.
That process is documentation, not verification.
Independent verification means the system must determine, from observational evidence alone, what crop occupied a specific field in a specific year. It cannot ask the farmer. It cannot consult planting records. It reads the electromagnetic signature of the canopy and makes a classification.
Why classifying rotation is harder than it looks
In corn-soybean agriculture, the spectral difference between the two crops is real and physically grounded. Corn and soybeans use different photosynthetic pathways, which produce different reflectance signatures at different times in the growing season. A satellite can detect this metric signature™.
The question is whether it can detect this signature reliably enough, across enough years, to support a regulatory claim.
That question turns out to be harder than expected. Three structural challenges emerged when we tested rotation classification in Ohio:
First, the spectral boundary between corn and soybeans is not fixed. It shifts year to year as weather, planting dates, and growing-season conditions change. A classifier calibrated to one year’s conditions can look excellent in-sample and fail badly out-of-sample.
Second, not all cropland is corn or soybeans. Ohio has winter wheat, oats, and other crops that a binary corn-soy classifier must either handle or honestly exclude. We found that roughly 6% of planted acreage in our Ohio test counties is wheat or oats — enough to bias the result if ignored.
Third, classifier accuracy at the pixel level is not the same as accuracy at the county level. A system can correctly label most individual pixels and still systematically overestimate one crop at the aggregate level if its errors are asymmetric. We discovered this bias when our per-pixel accuracy looked acceptable, but our county-level corn fraction was consistently inflated.
Any one of these problems can invalidate a rotation claim. Together, they explain why few verification systems publicly show that they have tested their crop identification against independent benchmarks.
Why two counties?
We tested crop rotation verification in two Ohio counties because a single county cannot reveal whether a method is robust or merely lucky.
Putnam County sits in northwest Ohio’s Maumee Basin, inside the procurement radius of an operating ethanol facility. Its crop mix is stable: roughly 37% corn and 63% soybeans year after year. That stability makes it a strong validation target; any year-to-year variation in the satellite result must come from classifier behavior, not from real changes in the landscape.
Darke County is in western Ohio; one of the state’s most productive agricultural counties. Its crop profile is fundamentally different from Putnam’s: a nearly 50-50 corn-soy balance, with corn shares ranging from 46% to 50% across the observation period. Darke tests whether the same pipeline works across a different crop mix, a different geography, and a different set of spectral conditions.
If the method works only in the “easy features” county, it is not a verification system. It is a demonstration.
What did we find?
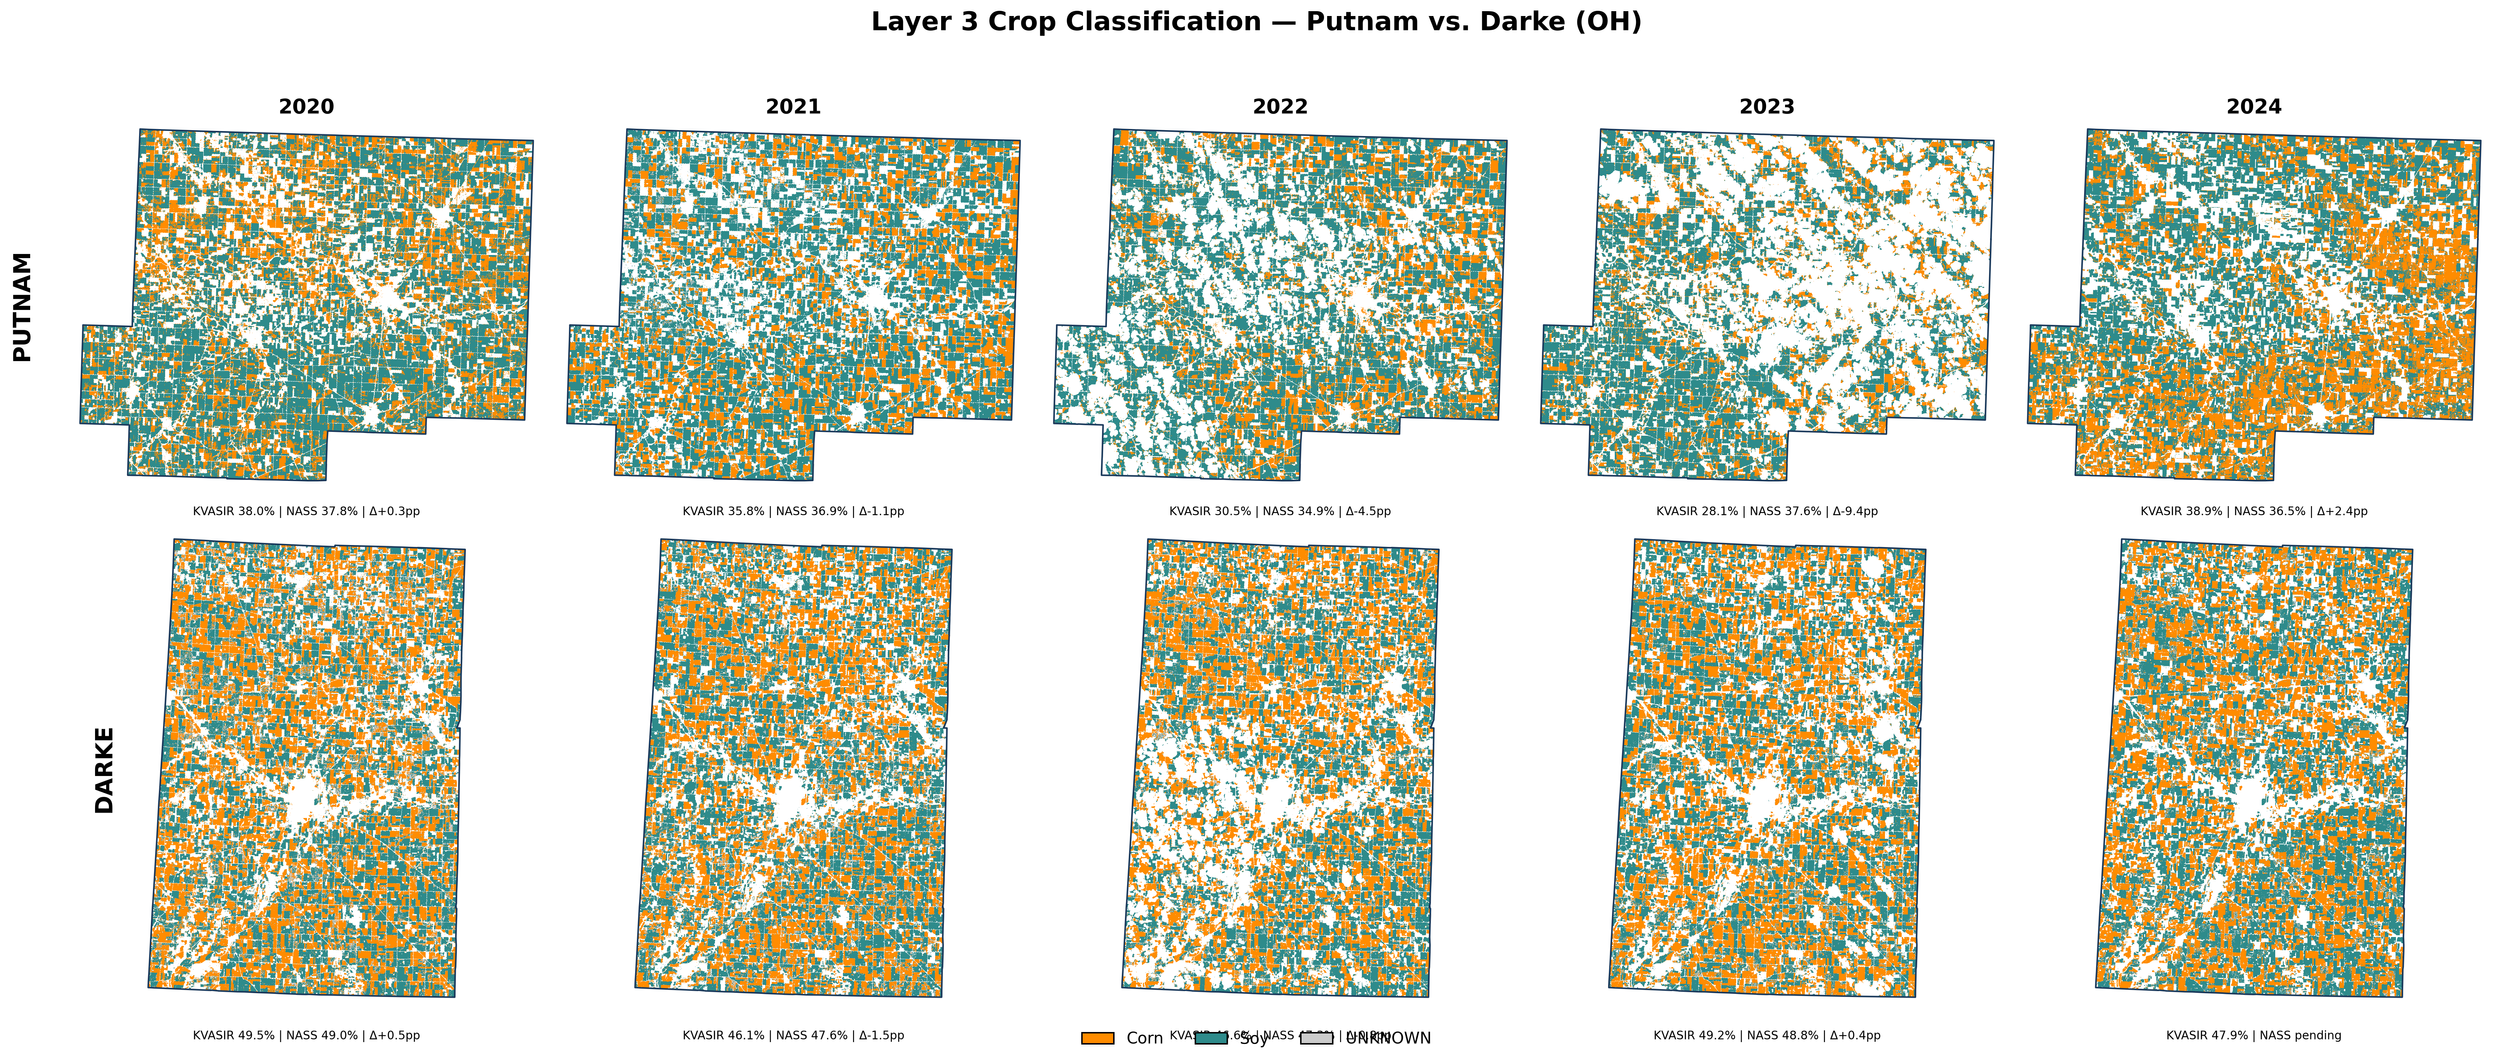
Layer 3 Crop Classification — Putnam (top) vs. Darke (bottom), 2020–2024. Orange = Corn | Teal = Soybeans | Gray = UNKNOWN
| Year | Putnam KVASIR | Putnam NASS | Putnam Δ | Darke KVASIR | Darke NASS | Darke Δ |
|---|---|---|---|---|---|---|
| 2020 | 38.0% | 37.8% | +0.3pp | 49.5% | 49.0% | +0.5pp |
| 2021 | 35.8% | 36.9% | −1.1pp | 46.1% | 47.6% | −1.5pp |
| 2022 | 30.5% | 34.9% | −4.5pp | 46.6% | 47.3% | −0.8pp |
| 2023 | 28.1% | 37.6% | −9.4pp | 49.2% | 48.8% | +0.4pp |
| 2024 | 38.9% | 36.5% | +2.4pp | 47.9% | pending | — |
| Mean |Δ| | 3.5pp | 0.8pp |
Corn fraction (planted acres). Darke 2024 NASS data have not yet been published; the 0.8pp mean is based on the four years (2020–2023) with available USDA comparison data.
Putnam County — mean error: 3.5 percentage points
We classified every corn-soy pixel in Putnam County at 10-meter resolution for each year from 2020 to 2024, then compared the aggregate corn fraction against USDA’s independent county-level estimates.
In Putnam, 2021 was the only year where the primary spectral channel lost enough discriminating power to require a multi-band rescue. In the other four years, the system’s primary classifier handled the separation directly. After escalation in 2021, all five years fell within the validation range.
No farmer was enrolled. No self-reported planting data was used. Every classification comes from independently archived satellite observations, supervised by USDA’s own annual crop map.
Darke County — mean error: 0.8 percentage points
In Darke, the more balanced crop mix made the richer multi-band classifier necessary throughout. Every year required the system to escalate beyond its primary spectral channel because the signal quality was consistently below the automated quality threshold. That is the pipeline working as designed; it detected harder signal conditions and adapted automatically.
For the four years where independent USDA data was available (2020–2023), the satellite results matched within 1.5 percentage points or better in every case. The 2024 NASS county estimate has not yet been published; that year’s classification is complete but awaits external validation.
Darke’s UNKNOWN rates ranged from 4% to 8%, reflecting the inherent difficulty of classifying a balanced crop mix. Those UNKNOWN acres are not hidden. They are carried in the denominator and counted against the claim.
What does this tell us about rotation?
Before examining the rotation maps, four classification categories need to be defined:
Confirmed rotation: the pixel alternated between corn and soybeans in at least three of four year-over-year transitions; a strong, consistent alternation pattern.
Partial rotation: the pixel alternated crops in two of four transitions. Rotation occurred but was not consistent across the full observation window.
Continuous corn or continuous soy: the pixel showed the same crop in four or more of five years.
Untrackable: the pixel was classified as UNKNOWN in at least one year, breaking the temporal chain and preventing any rotation determination.
All rotation percentages below are computed on trackable cropland only. Untrackable pixels are excluded from the rotation denominator because their sequence is incomplete. This is the conservative choice: no rotation credit is given to acres where any single year’s crop identity is uncertain.
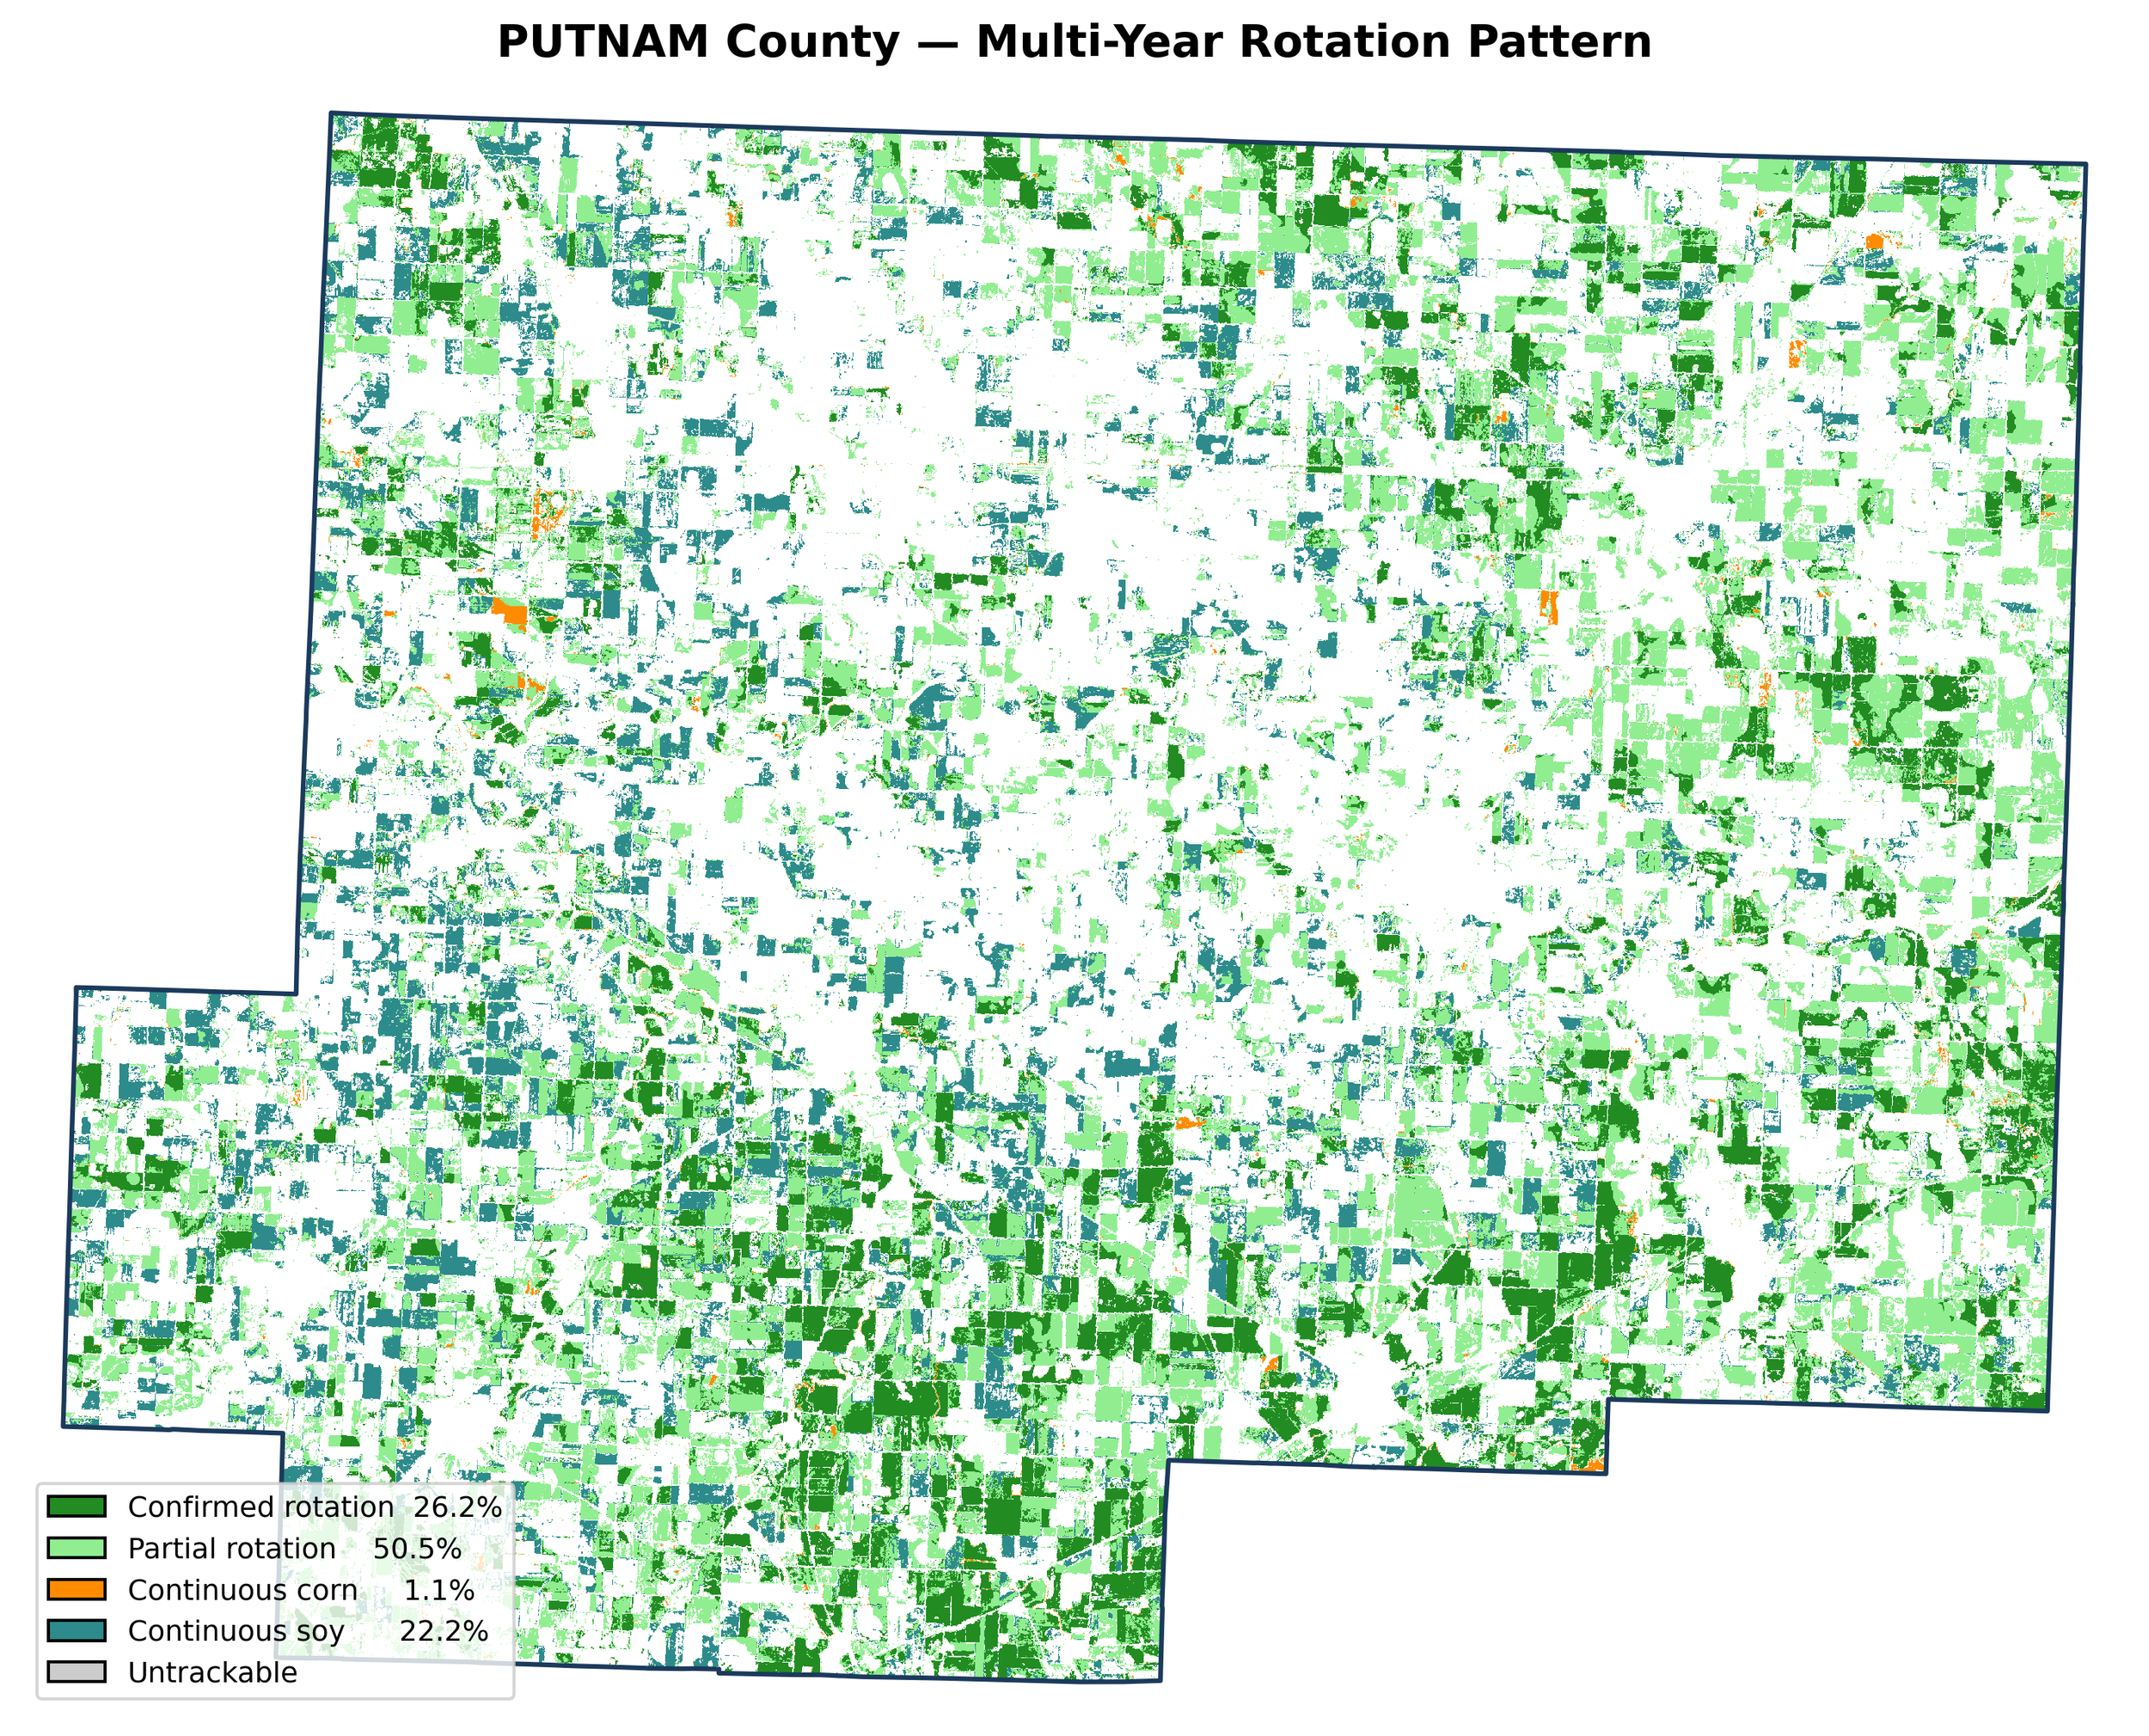
Putnam County — Multi-Year Rotation Pattern. Confirmed rotation: 26.2%. Partial rotation: 50.5%. Continuous corn: 1.1%. Continuous soy: 22.2%.
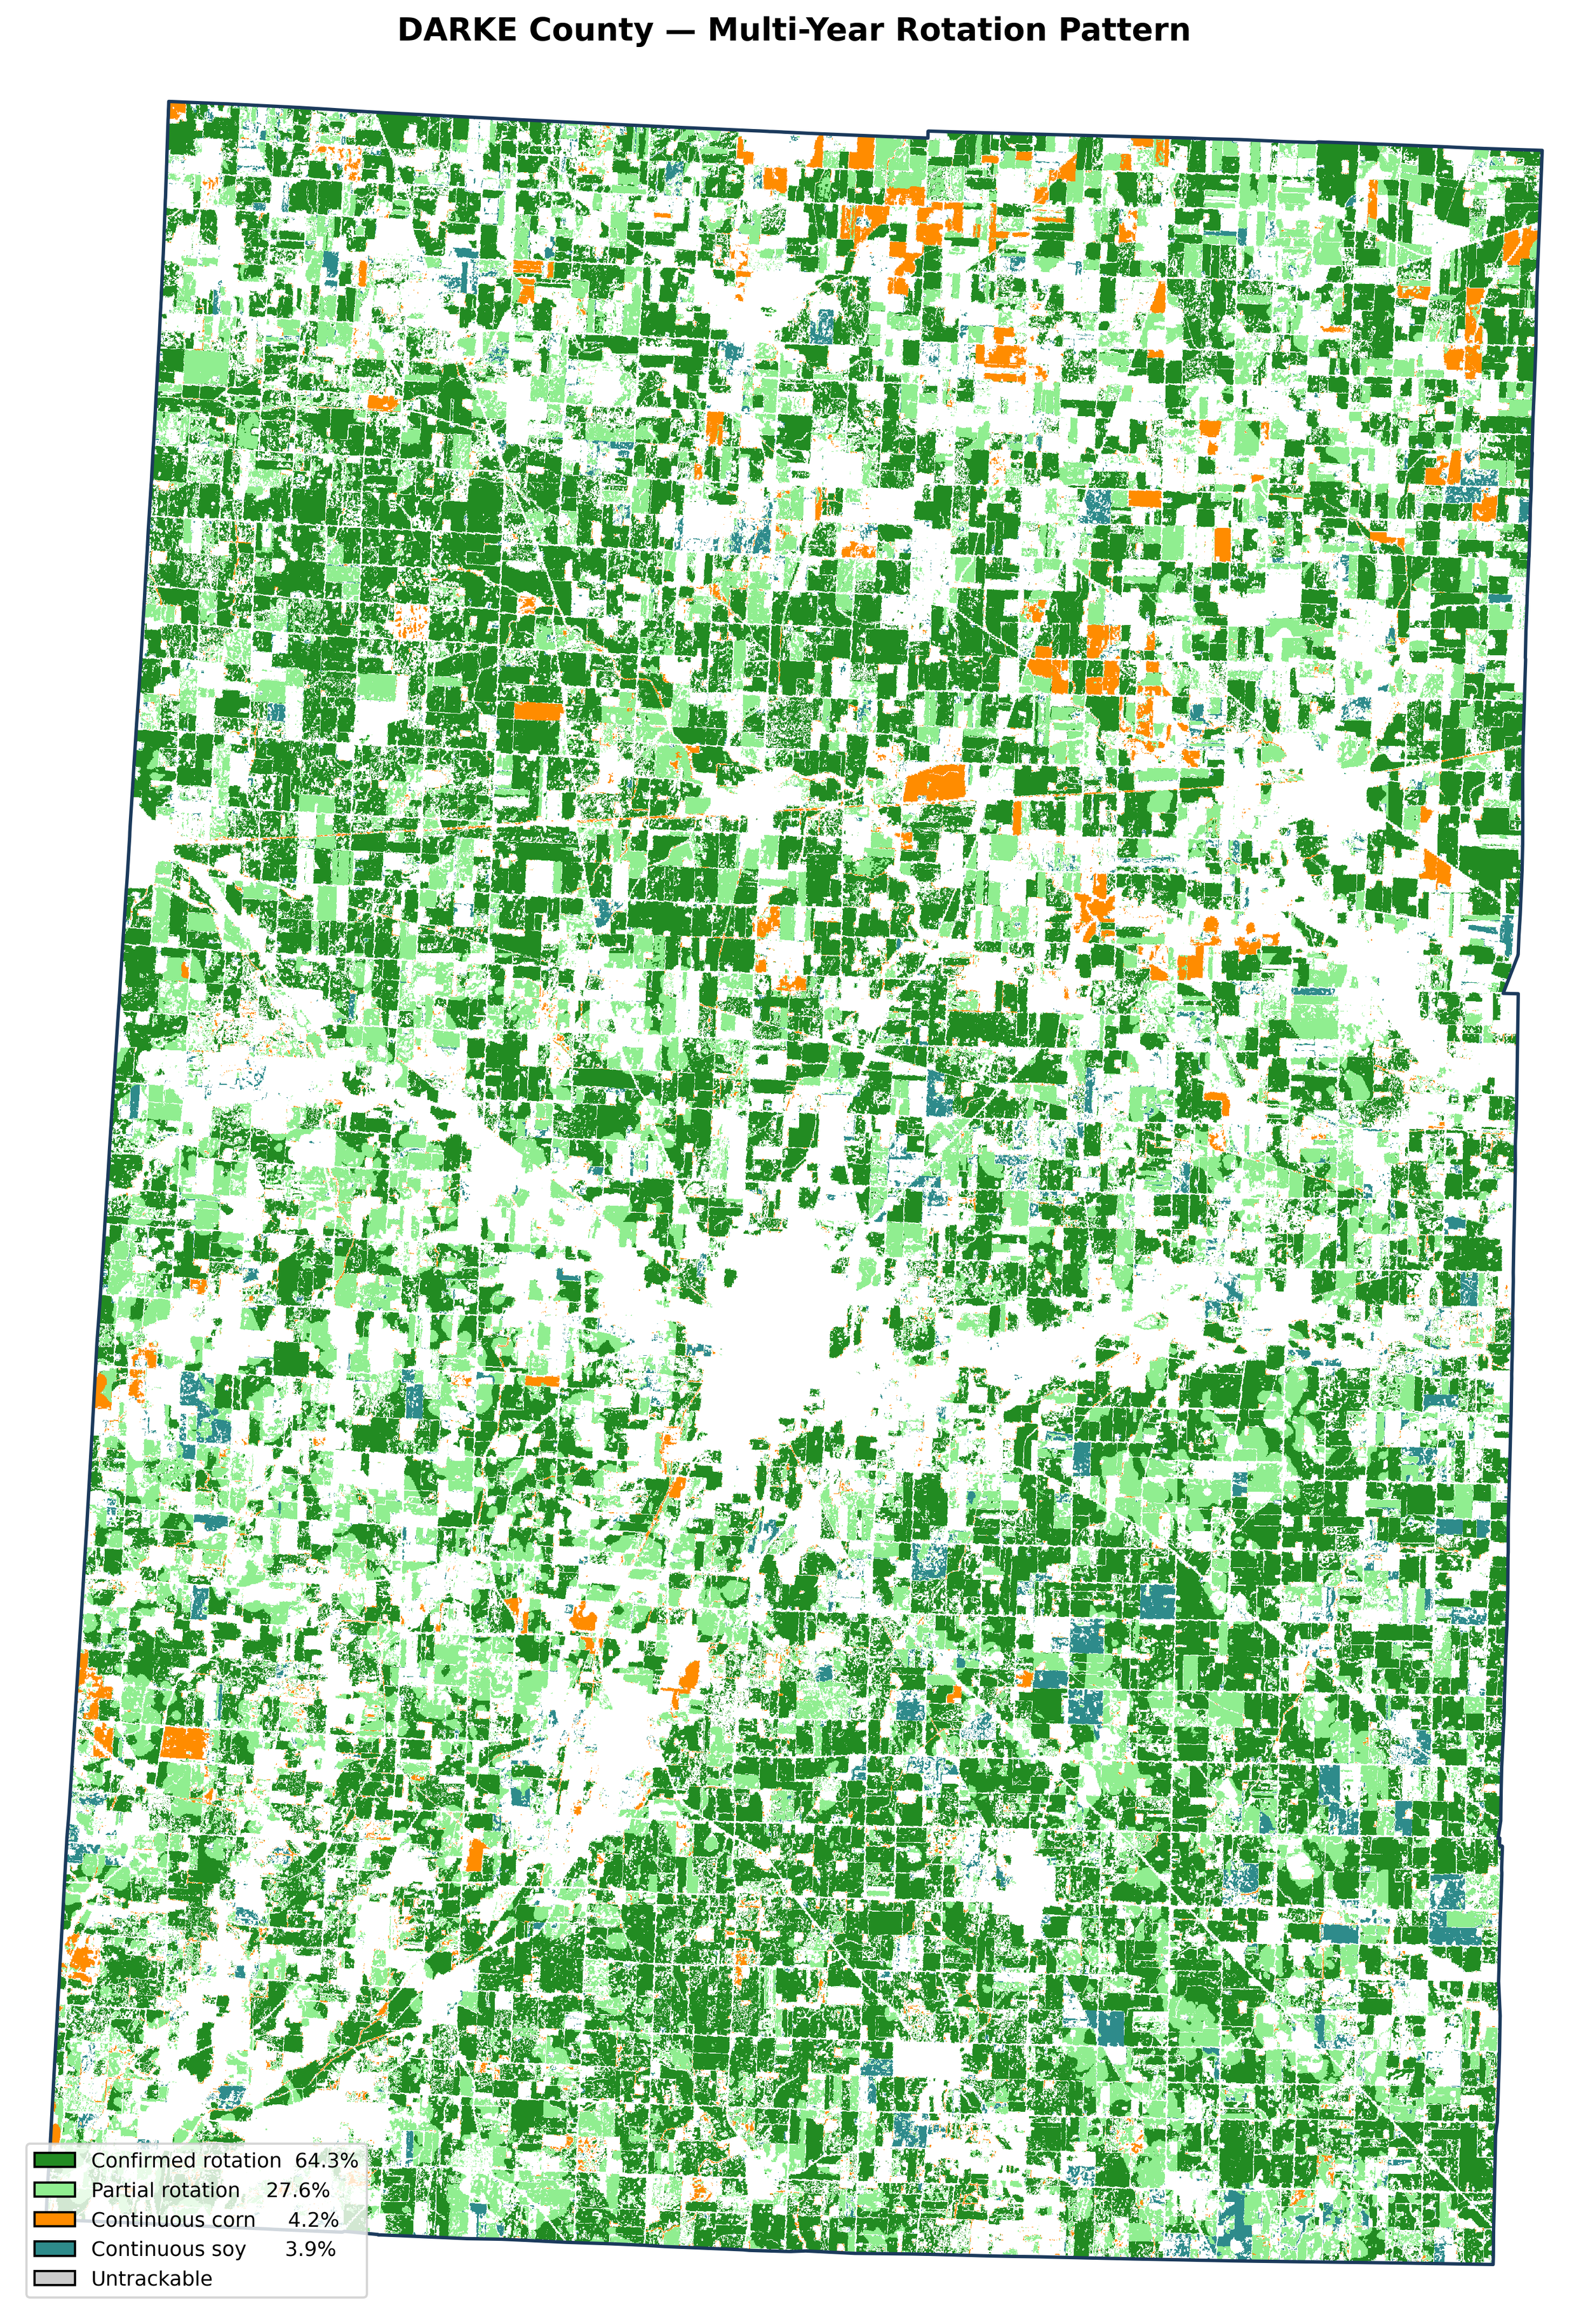
Darke County — Multi-Year Rotation Pattern. Confirmed rotation: 64.3%. Partial rotation: 27.6%. Continuous corn: 4.2%. Continuous soy: 3.9%.
The two counties tell different but complementary stories.
In Putnam, 76.7% of trackable cropland shows rotation behavior, with 22.2% in continuous soybeans, reflecting a real agronomic pattern in the soy-heavy Maumee Basin. Continuous corn is nearly absent at 1.1%.
In Darke, 91.9% shows rotation behavior, with continuous corn and continuous soy each below 5%, consistent with the county’s balanced crop mix driving stronger alternation.
Both results match what agronomists would expect from these landscapes. The difference is not classifier bias. It is agricultural reality, independently observed.
For an ethanol CFO, these maps answer a specific question: within my sourcing radius, how many acres can I substantiate as practicing crop rotation based on independent observational evidence?
The answer is not “all of them.” And it is not “none of them.” It is a precise, field-specific, auditable number.
Why the UNKNOWN category matters most in Layer 3
Crop rotation verification compounds uncertainty across years. A pixel that is UNKNOWN in any single year cannot have its rotation status confirmed, because one missing year breaks the temporal chain.
That is why UNKNOWN rates matter more in Layer 3 than in any other layer. A tillage classification can tolerate some UNKNOWN acres because each year stands alone. A rotation classification cannot, because the claim depends on the sequence.
A verification system that forces ambiguous years into a classification is not being conservative. It is manufacturing evidence.
What this means for an ethanol facility
A plant CFO looking at Layer 3 should see four practical answers:
- Which specific acres in my sourcing radius are practicing crop rotation, based on independent evidence?
- Which acres appear to be in continuous monoculture?
- Which acres have too much uncertainty to make a claim either way?
- How does this compare to independent USDA data for the same county and years?
Those four answers, produced without any grower enrollment, form the rotation component of a substantiation strategy.
Combined with Layer 1 (conservation tillage) and Layer 2 (cover crops), they begin to build the field-level evidentiary record that §45Z ultimately requires.
What made this hard — and why that matters
This article presents clean maps and validated numbers. What it does not show is the diagnostic work behind them.
The initial classifier failed. It looked excellent in its calibration year and produced large systematic errors in every other year. We did not publish that result. We diagnosed it, identified three structural causes, corrected them in sequence, and validated the corrections against independent data before producing these maps.
That process took six experimental iterations, each building on the findings of the last.
We describe this not to demonstrate sophistication but to make a practical point: crop rotation verification is genuinely difficult, and any system that presents it as simple has either not tested itself honestly or has not disclosed the results of that testing.
A verification architecture earns credibility not by avoiding hard problems, but by being transparent about how it solves them.
What comes next
This is Layer 3 of a four-part substantiation architecture.
Layer 4 will show what happens when all three practices are measured together on the same acres, and what the resulting verification footprint means for a real ethanol facility’s §45Z strategy.
Because a defensible §45Z strategy does not rest on whether a report moved through the chain.
It rests on whether the field-level facts beneath the claim can be independently tested.
Download the full article with maps
Get the complete Layer 3 verification article as a PDF, including classification maps, rotation patterns, and NASS validation data.
Register to download →